Adani Powermind Hackathon
We won the Adani Powermind Hackathon. My model was 4x worse than I thought.
Our team won with an energy-forecasting platform. I built the forecaster, reported a dazzling 0.65% error, and later discovered the dazzle was a leak. Here is the autopsy, and the honest number.
- Result
- Winner
- Role
- Team of 5 · I built the LightGBM model
- Published
- Nov 2026
- Read
- 5 min
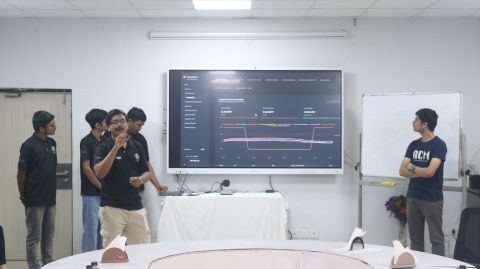
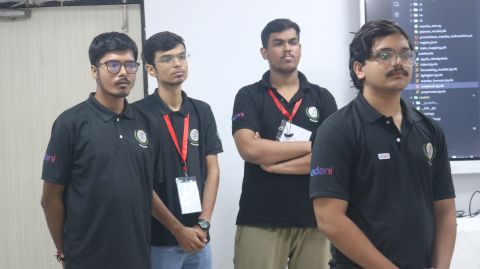

The Adani Powermind Hackathon asked teams to forecast electricity demand and build a system around the forecast. We got six years of hourly demand data and complete creative freedom, which is hackathon for "good luck". Our team built Prometheus, a grid console with demand forecasts, anomaly alerts and a retraining flow, and we won.
place
1st
day-ahead MAPE
2.59%
less error than naive
30%
hourly rows
52k
We did not open a laptop for a while
When the dataset and the rules landed, we did the least hackathon thing imaginable: we did not start coding. We spent the first stretch on heavy research into the problem statement. Why does demand forecasting matter to a power company? How would a forecast actually be used at Adani, and where might it fit their future ventures? Only once we could answer those without waving our hands did we open the data.
There were five of us: me and four juniors. Gaurav, Aayush and I built the forecasting model and the MLOps around it, so the model could forecast and also keep learning from new data as it was uploaded. Arshad built an agentic grid-management feature. Manav built the frontend and, crucially, made it good-looking, a skill the rest of us admire from a safe distance. Around the forecast we added:
- Anomaly detection inside the MLOps pipeline, so strange demand gets flagged instead of quietly retrained on.
- Rollbacks, so a bad retrain can be undone rather than lived with.
- An option to trade excess energy on the market.
My own piece was the LightGBM forecasting model and the data preparation behind it. Teammates also tried XGBoost and CatBoost, and trained a temporal convolutional network for the final submission. This post is about the part I can defend line by line, including the line I got wrong.
Listen to the data first
The exploratory analysis turned up the expected thing and one surprise. The expected thing: the demand was strongly seasonal. The surprise: the seasonality did not look like India's, so the data did not appear to be from India at all. Useful to know before you start explaining every spike with a festival.
Before touching a model, I wanted to know what the series was actually doing. I capped outliers at the 1st and 99th percentiles, then stared at autocorrelation plots and a periodogram until they confessed. The periodogram had two enormous spikes, at 24 hours and 168 hours: a daily rhythm and a weekly one. Electricity, it turns out, has a commute.
The model
The features were demand at earlier hours, rolling means and standard deviations, sine and cosine encodings of hour and month, day of week, and weekend and business-hour flags. The data was split chronologically and never shuffled, and hyperparameters were tuned with time-series cross-validation, so every fold trained on the past and was tested on the future, as nature intended.
LightGBM beat SARIMAX handily and matched XGBoost while training faster. During the hackathon, walk-forward validation over the last two weeks reported about 0.65% MAPE. I was, briefly, insufferable.
Mentors, judges, and an exam
Three mentor rounds punctuated the build. They were friendly but thought-provoking. The first two each handed us something better to think about, so we went away and thought about it. By the third, we had the answers ready before the questions arrived.
In the final judging round we were the first team to present, which is a special kind of nervous: nobody to calibrate against, and no idea who the judges even were. So we did the only thing available and gave it our best. The business case seemed to land with them, and when they pushed on our decisions, we could defend every one.
Then I left. I had an exam the next day, so I was gone in the morning, long before any results. I found out we had won only after I had finished the paper. As a format, I recommend it: there is no time to agonise over the verdict when you are busy agonising over something else.
The plot twist
0.65% was too good to be true, and after the hackathon I worked out why. One of my features was demand one hour earlier. The walk-forward check predicted a whole day at a time, but it handed the model the true value of that feature for every hour of the day, including the ones 20 hours in the future. In real life, the demand one hour before a moment 20 hours away has not happened yet. My model had, in effect, been reading tomorrow's newspaper.
Re-measuring it, properly this time
So I rebuilt the evaluation under the rules a real day-ahead forecast has to live by, and published the script with the repo so nobody has to take my word for it:
- Every feature is at least 24 hours old when the prediction is made: lags of 24, 48 and 168 hours, and rolling statistics that end a day earlier.
- Train on 2016-2019, choose the model on 2020, test on 2021 exactly once. The test year is never consulted about anything.
- Fit nothing on the test data. Even the outlier caps come from training rows only.
- Beat the lazy forecasts under the same rules: "same hour yesterday" and "same hour last week". If a model cannot beat yesterday, it is decoration.
LightGBM, 24h ahead
2.59%
same hour yesterday
3.73%
same hour last week
5.75%
LightGBM, 1h ahead
0.66%
The honest day-ahead number is 2.59% MAPE on 2021. It was also 2.59% on the 2020 validation year, so the model is not overfitting, merely being honest for once. That is about 30% less error than the best naive forecast. And the one-hour-ahead setup reproduces the original 0.65% almost to the decimal, which settles exactly where that number came from.
What I do differently now
- 1Fix the horizon before the features. Decide what the forecast is for, then allow only information that exists at forecast time.
- 2Report error by horizon. Hour 1 and hour 24 are different problems, and a single average politely hides that.
- 3Always show the naive baseline. For demand data, "same hour yesterday" is embarrassingly strong. Beat it clearly or go home.
- 4Treat a surprising number as a bug until proven innocent. A sub-1% error should have sent me hunting for leakage on day one, not after the trophy.
The real prize
Winning was lovely. The lesson I use every week came from the post-mortem, though: an evaluation has to match how the model will be used, or the metric is just a very precise compliment. I check that before I train anything now, and it is a large part of why the validation in later work, like the Amazon ML Challenge, held up on the leaderboard.